DigitalOcean Connection Pool Metrics
June 25, 2022
devops
digitalocean
DigitalOcean is a player in the Infrastructure-as-a-Service (IaaS) market, competing with options such as Amazon Web Services (AWS), Google Cloud Platform (GCP), as well as other “low cost” providers such as Linode.
Amoung these services, DigitalOcean has their “Managed Database” offering. One of the downsides of this offering is the terribly low connection limits, particularly on Postgres. In order to address this, DigitalOcean offers managed Connection Pools as well.
Details of how a postgres connection pool works is outside the scope here, however as a brief summary the connection pool accepts a number of client connections, and then load balances upstream server connections between the clients.
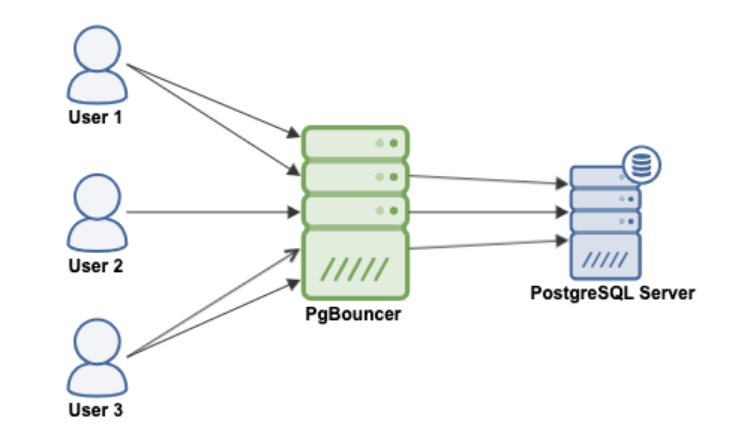
Typically the count of connected clients is much greater than the number of server connections. More detailed information around connection pools can be found here.
As you likely realized, having more clients actively trying to utilize the database than available server connections can lead to blocking at the connection pool level. This latency will be visible to the application, but not reflected in any query metrics at the database level. This ties “database performance” directly to the connection pool performance, and the connection pool needs to be explicitly monitored.
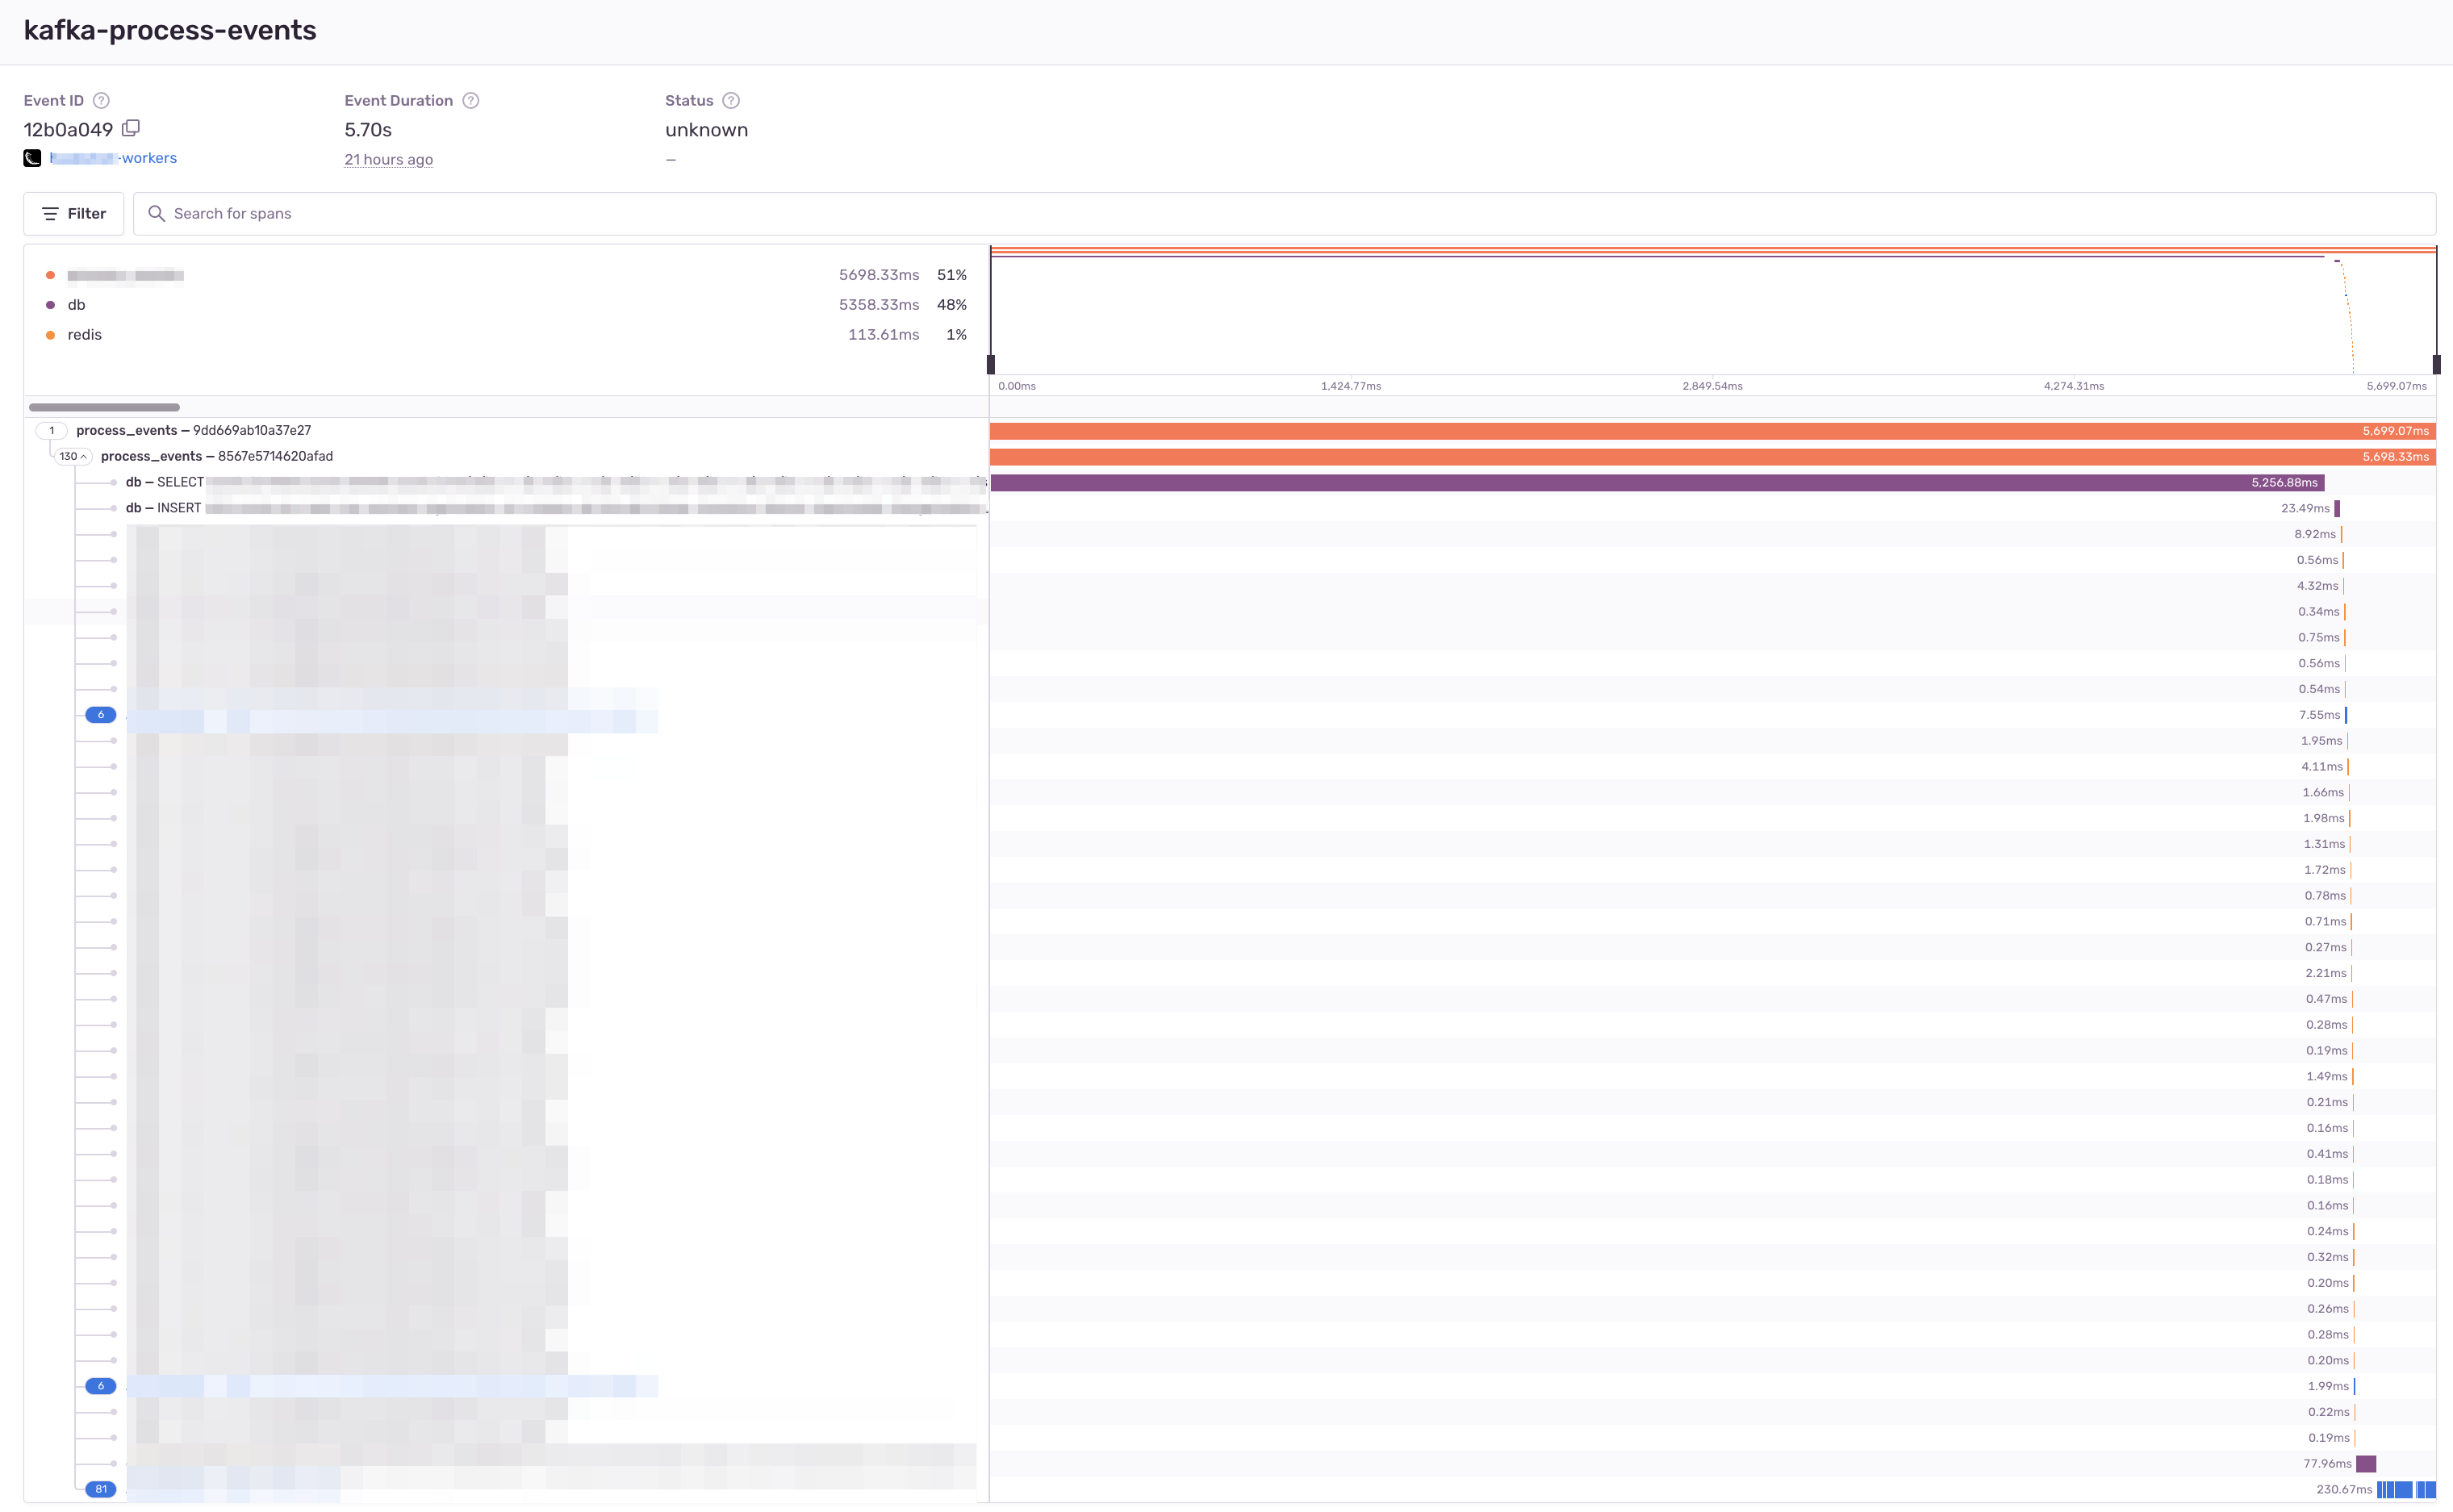
As an example, the following trace shows an over 5000ms span for a 50ms database query. 99% of this trace time is spent blocked at the connection pool.
Unfortunately DigitalOcean does not expose any Connection Pool metrics through their APIs or documentation.
Grabbing PGBouncer metrics directly
Luckily, after a bit of digging, I was able to determine that DigitalOcean Connection Pools are not just “based on” pgBouncer, they are an explicitly an exposed pgBouncer process running on the same host (likely, container) as the managed database. You can use any pgBouncer monitoring tool by pointing it at the pgBouncer address, such as a prometheus exporter, or Datadog.
All of these tools work by connecting to the special pgbouncer “database” that allows the execution of admin commands. You can also connect directly to view pgbouncer status without using a third-party tool.
A couple quick (and useful) commands:
SHOW pools;cl_waiting: count of clients currently blockedmaxwait+maxwait_ushow long the oldest client has been blocked
SHOW databases;pool_size: maximum count of server connectionscurrent_connections: count of current server connections
There are a couple of known issues with the metrics that pgBouncer provides.
- Client wait time is expressed as combination of multiple columns (
maxwaitandmaxwait_us). These metrics have to be combined by the user to get a “real” maximum wait time - Distributions of client wait time are not provided. These could be calculated by a client using the client metrics (from
SHOW CLIENTS)
Disclaimer: DigitalOcean links in this post are affiliate links. If you don’t want to use them, feel free to not.