Using PGAnalyze
May 23, 2018
ops
postgresql
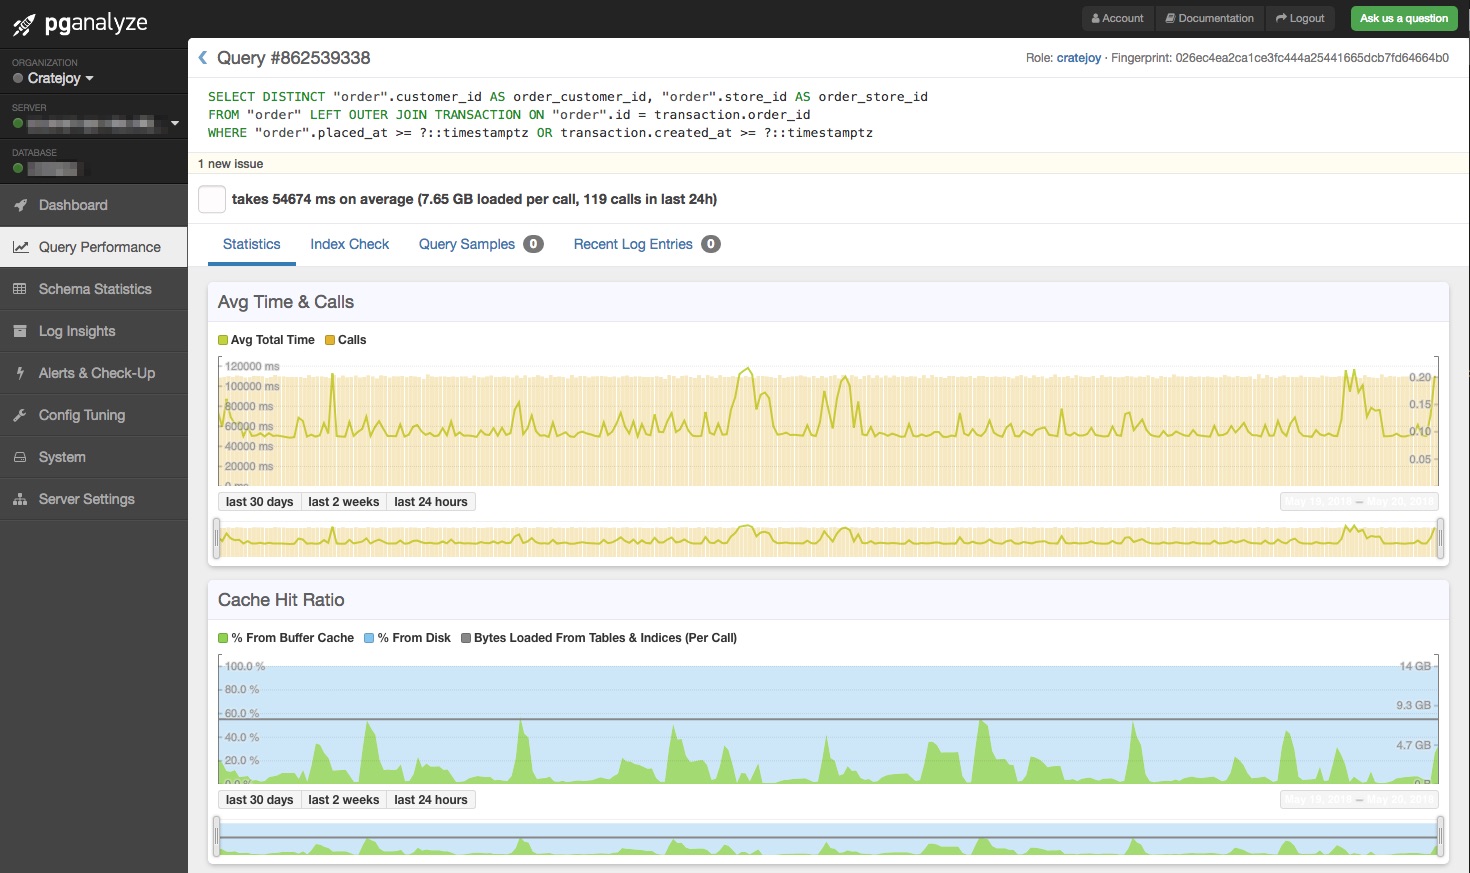
We recently set up PGAnalyze as a way of doing a quick database health check, and managed to get a couple quick wins out of it.
By looking at the Query Performance section, we were able to quickly identify a bad outlying query which was accounting for ~7.5% of our total DB activity. Furthermore, we were able to see that this query was loading ~7.65 GB of data per call, with the majority of the data needing to be loaded from disk (rather than buffer cache), and was taking almost a full minute on each execution.
It’s important to note that all of this information was available through other means (mostly through the
pg_stat_statementsextension that pganalyze is dependent on), however PGAnalyze was able to make this information clearly available.
Optimizing the Query
The query in question is as follows:
SELECT
	DISTINCT "order".customer_id,
	"order".store_id
FROM
	"order"
	LEFT OUTER JOIN TRANSACTION ON "order".id = transaction.order_id
WHERE
	"order".placed_at >= ?::timestamptz
	OR transaction.created_at >= ?::timestamptz
By looking at the EXPLAIN of this query (which PGAnalyze will also pull in if the log_min_duration_statement is configured, and the query run-time exceeds it), we can see that this query is requiring seq scans of both tables. The OR is preventing the query planner from using indexes on either table.
Luckily, in this case we can easily rewrite this query in a way that does not prevent index usage.
SELECT
	DISTINCT customer_id, store_id
FROM (
	SELECT
		"order".customer_id,
		"order".store_id
	FROM
		"order"
	WHERE
		"order".placed_at >= ?::timestamptz
	UNION
	SELECT
		DISTINCT "order".customer_id,
		"order".store_id
	FROM
		"order"
		JOIN TRANSACTION ON "order".id = transaction.order_id
	WHERE
		transaction.created_at >= ?::timestamptz
) tmp;
By looking at results from each table individually, and unioning our results, we can get the same results without the need for any large join operations. The new version of this query completes in ~2ms; giving us an approximate 99.9966% improvement.
Lessons Learned
Throughout this, we were able to pull a couple lessons out.
- PGAnalyze is a great tool, and I would highly recommend settings it up (even if just for a short period of time)
- Experimenting with new monitoring tools can lead to unexpected wins. We likely would not have found and fixed this query without PGAnalyze.
- Taking a step back with problem queries can be more effective than attempting to optimize the existing code.
Hopefully this works out for you, or was at least helpful. If you have any questions, don’t hesitate to shoot me an email, or follow me on twitter @nrmitchi.